2. Key characteristics of active travel
2.1 Introduction
Understanding the level of demand for active travel and relevant demand characteristics is critical to the efficient provision of active travel infrastructure.
The demand for active travel facilities is driven primarily by population (trip generation) and land use (trip generation and purpose). The extent, location and demography of the population will create the demand. The demography of the population (gender, age and ability) is an influencing factor. For example, a high density residential area within active travel proximity to an education institute and large employment centre could have a high active travel demand for employees and students. In this example, land use is a significant aspect as it relates to trip purpose and trip generation. Land use planning also relates to trip distance, which is an important factor in determining whether people consider walking or cycling for their daily commute.
2.2 Characteristics of active travel
2.2.1 Mode share
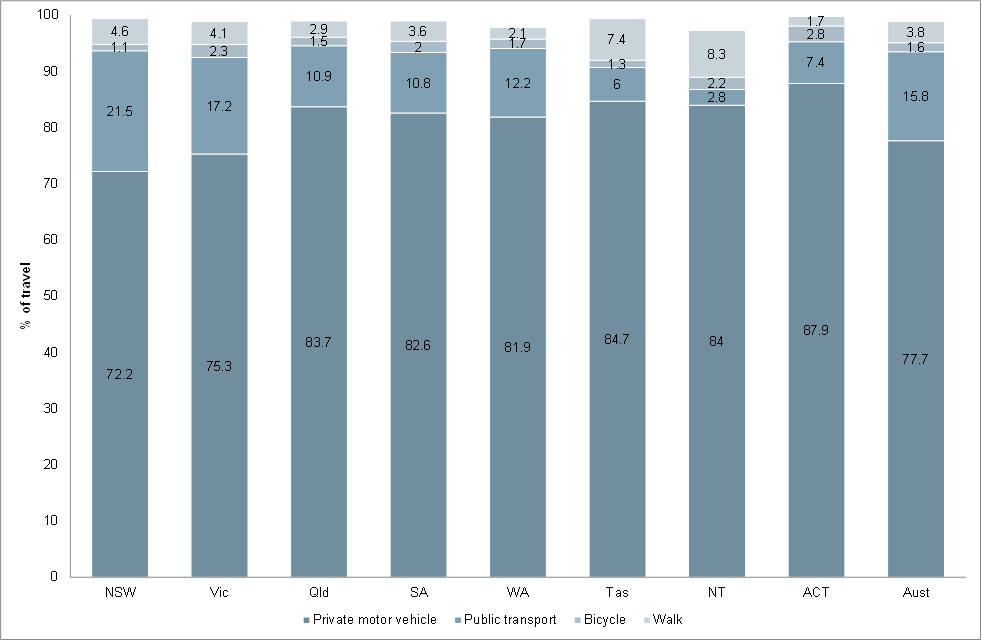
Walking is probably the most common form of travel as it is involved to some degree in all trips undertaken by all other modes. However, only about 4% of work or study trips in Australia rely solely on walking - making it the third most common mode, as shown in Figure 1. By comparison, cycling accounts for between 1.1% and 2.8% of trips for work or study.
According to international comparisons in Litman (2014, p.7), Australian levels of active travel are a fraction of those in European countries and among the lowest in the developed world.
Figure 1: Main mode of travel to work
Source: ABS (2012)
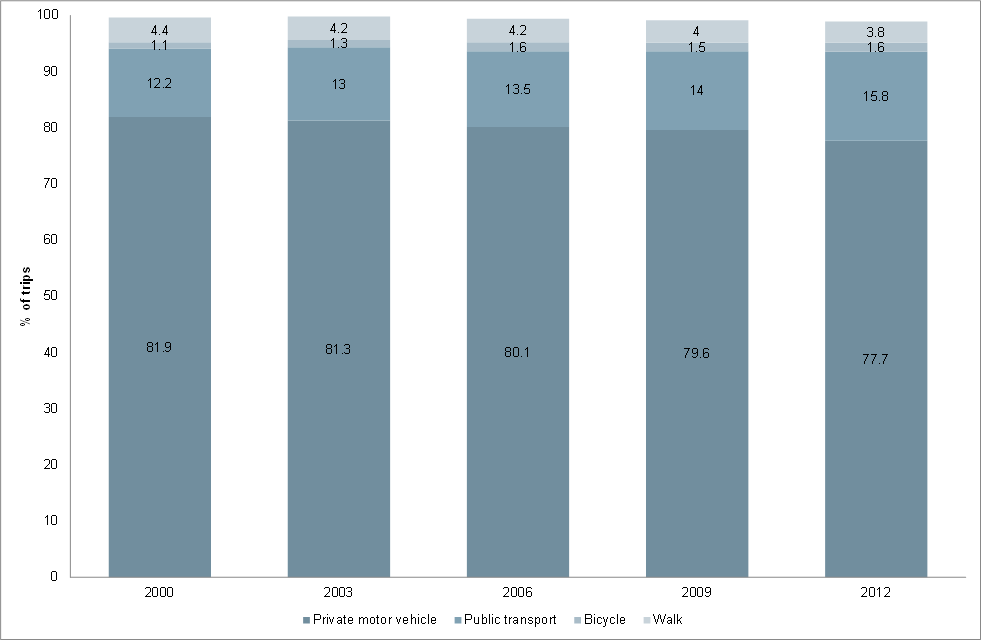
Between 2000 and 2012, cycling trips as a proportion of all adult work or study trips increased from 1.1% to 1.6%, while walking trips declined from 4.4% to 3.8%. Over that period, the proportion of trips made by public transport increased from 12.2% to 15.8% and private motor vehicle trips decreased from 81.9% to 77.7% (see Figure 2). By 2012, walking and cycling made up 5.4% of all adult work or study trips.
Figure 2: Main mode of travel to work or study, 2000 - 2012
Source: ABS (2012)
2.2.2 Trip length
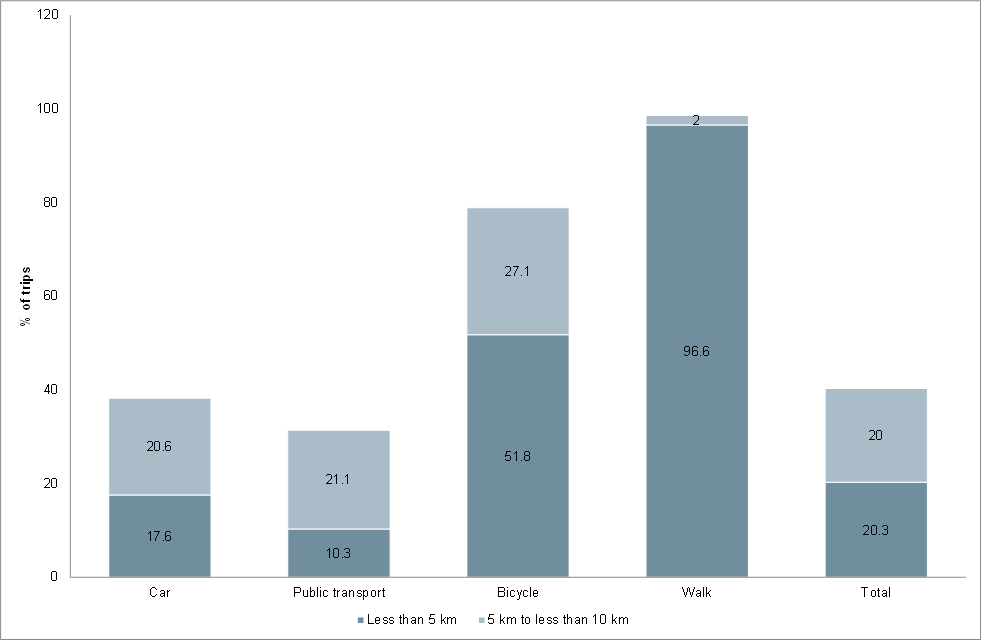
The majority of walking and cycling commuting trips are less than 5 km (96% and 52% respectively), as shown in Figure 3.
Figure 3: Proportion of distance travelled by mode
Source: ABS (2009)
2.2.3 Trip frequency
According to the National Cycling Strategy (Australian Bicycle Council 2014, p.44), cycling is dominated in terms of numbers of cyclists by those who cycle for recreational purposes. This group outweighs ‘transport’ cyclists by a factor of nearly three to one[1]. Surveys of walkers and cyclists conducted in Brisbane in 2011 (SKM/PWC 2011, pp.78-79) found that on major off-road pedestrian/cycle corridors, transport trips were generally dominant on weekdays and recreational trips dominated on weekends. Estimates for Sydney contained in Aecom (2010, p.22) suggest that work trips by bicycle make up about 8% of all cycle trips. Trip frequency estimates are not available for walkers but according to the National Cycling Strategy, 83% of Australians did not cycle in the week prior to being surveyed (Australian Bicycle Council 2014, p.44).
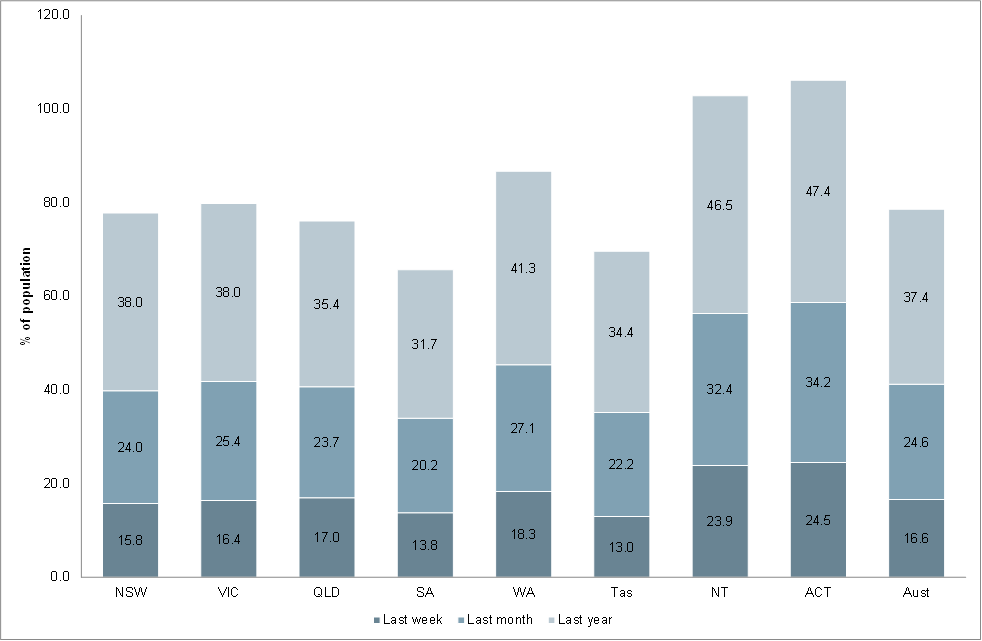
The proportion of the population that rode a bicycle in the last week, month or year is shown in Figure 4. Tasmania has the lowest proportion of people regularly riding a bicycle (13%), with the Australian average being 17%. A further 25% of Australians had ridden a bicycle in the previous month.
Figure 4: Proportion of population that rode a bicycle
Source: Australian Bicycle Council (2014)
2.2.4 Crash risk
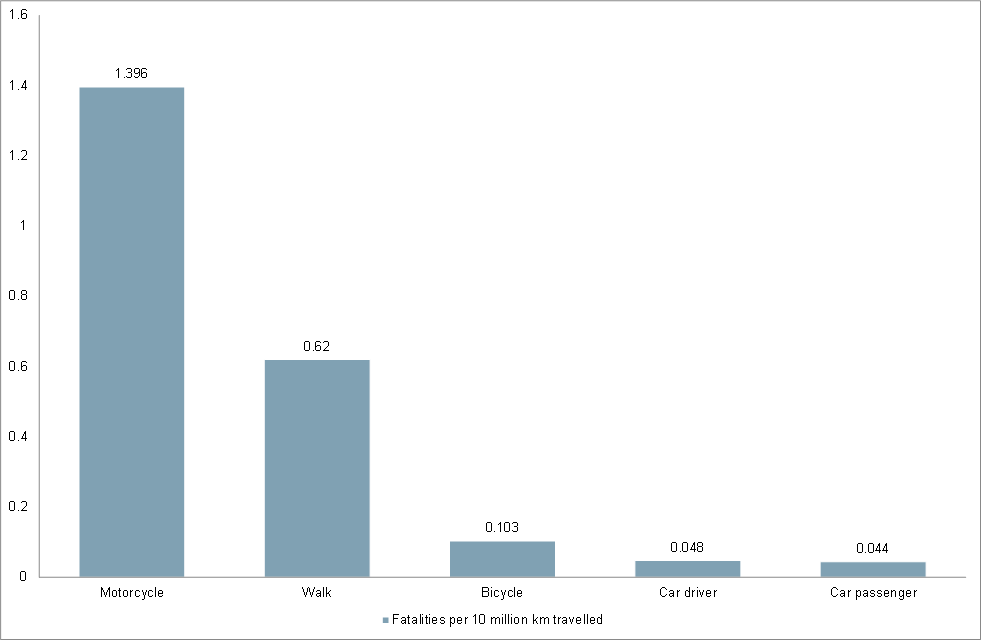
Between 2002 and 2006, pedestrians and cyclists represented 15% and 2% respectively of all road-related fatalities (see section 5.5.1). After accounting for distance travelled, fatality rates (deaths per 10 million km) for walking and cycling are higher than car driving and travelling as a car passenger, but lower than motorcycle travel. In 2010, there were 0.62 pedestrian fatalities per 10 million km walked and 0.103 cyclist fatalities per 10 million km cycled in Australia. Fatal crash incidence for car occupants was 0.044 to 0.048 per 10 million vehicle km travelled.
The data in Figure 5 shows fatality rates for pedestrians and cyclists that are two to 12 times those for car drivers.
Figure 5: Fatality rates by mode
Source: Austroads (2010)
2.3 Determinants of active travel
A number of factors determine the propensity for people to choose walking and cycling over other modes.
- Infrastructure: Good quality, appropriately designed active travel infrastructure with meaningful network connectivity will maximise levels of active travel and improve safety given the underlying demand for walking and cycling.
- Gender: on average, males and females tend to walk about the same distance each day, although males cycle about 2.75 times further than females.
- Age: those aged 10-34 years tend to walk about 1.4 times the average, while persons aged 65+ years tend to walk significantly less (0.4 of the average). Those aged 10-14 years tend to cycle 2.8 times the average, compared with persons aged 15-34 years who cycle about 1.5 times the average, while those aged 60+ years tend to cycle about 0.25 times the average.
- Land use: some land uses tend to have a higher incidence of walk trips (for example, outdoor recreation facilities, indoor sports facilities, schools, tertiary institutions, public transport interchanges and hotels/motels) than others (such as retail shops, health services and bulky goods stores). By comparison, the incidence of cycle trips tends to be relatively low for schools, tertiary institutions and retail shops uses.
- Complementary uses/facilities: the propensity for active travel can be enhanced by the proximity of complementary land uses and facilities (such as a public transport interchange located close to a regional shopping centre or university).
- Scale and proximity: the propensity for active travel would be expected to increase with the scale of development, albeit at a diminishing rate, while active travel would be expected to increase with proximity of related uses.
- Safety, incorporating:
- Physical safety (such as trip hazards, inadequate path width, location of power/light poles and paths not navigable by wheelchairs, prams and the elderly)
- The effect on trip demand of perceptions that active travel infrastructure is unsafe (eg narrow footpaths or cycle lanes along a carriageway or poor crossing facilities).
- Security: personal security, or the lack of it, can be a major factor in limiting walking and cycling, particularly for females travelling either at night and/or on their own.
- Topography and climate: heat, high humidity, steep hills and rain have the potential to make walking and cycling less attractive relative to other modes of travel.
- Ancillary infrastructure: the availability of seating, drink fountains, shade planting, bicycle parking and directional signage can impact on active travel demand.
- Awareness: Potential active travel users might be unaware of the availability and advantages of active travel networks.
- End of trip facilities, such as showers and cycle storage, may reduce impediments to active travel.
Most of these determinants of active travel demand are pertinent to both walking and cycling. The availability of bicycle parking and end of trip facilities - such as showers and lockers - are more associated with cyclists. Perceptions about personal security might be more relevant to pedestrians, particularly at night.
2.4 Active travel infrastructure
A sustainable active travel network incorporates good quality walking and cycling infrastructure that is well maintained, safe, accessible, connected, illuminated and signed. The infrastructure should provide direct routes to trip destinations, including public transport facilities, and have appropriate end of trip facilities such as bike parking, showers, change rooms and lockers.
An active travel network will encompass:
- The road corridor enabling pedestrians and cyclists to travel along and across roads (that is, on-road facilities) and adjacent to roads (off-road cycle paths within the road reserve)
- Routes over public land such as parks, rivers and coastal paths, at transport interchanges and car parks (that is, off-road facilities)
- Private land including access points to buildings and parking areas and routes through private developments.
Nowadays, an established road user hierarchy forms part of many state and local transport planning authority strategies. Most active travel infrastructure is capable of accommodating or is relevant to both pedestrians and cyclists. On-road cycle lane facilities (including intersection treatments), bicycle parking and to a lesser extent end of trip facilities are exceptions.
Walking is included in most trips made by other modes. Whatever the main means of travel, walking is usually the first and last mode used (for example, via footpaths from public transport interchanges and parking areas). The majority of active travel takes place on, around or along the road corridor. Some elements of active travel infrastructure are complementary to the road network (such as footpaths along the edge of the carriageway) while other elements such as cycle lanes compete for road space. The design and construction of new roads and road upgrades should incorporate all road users at the earliest possible point in the planning process.
Off-road cycle paths can also provide an alternative route to the roadway. They may provide connectivity between appropriate land uses and offer a viable active transport alternative to using motorised modes.
Some pathways, such as recreational paths through parks, are independent of other transport modes.
[1] However, this is not the same as saying that recreational trips make up 75% of all cycling trips, because recreational cycling trip frequency might be lower than transport trip frequency.

